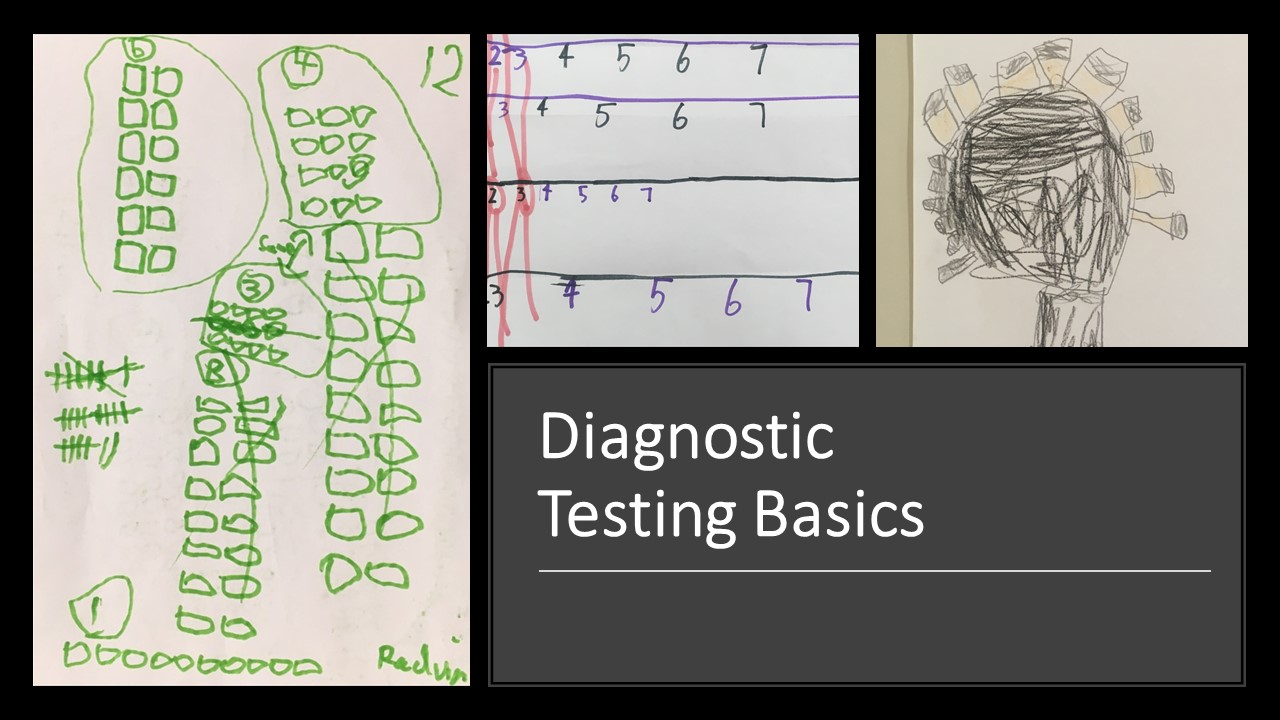
Formative assessment, developmental stages and starting the year well
The goal of formative assessment should always be to find out what each student NEEDS next, rather than focusing

Become a website member today and access hundreds of lessons for each year level F-8 plus Essential Maths for years 11 and 12.
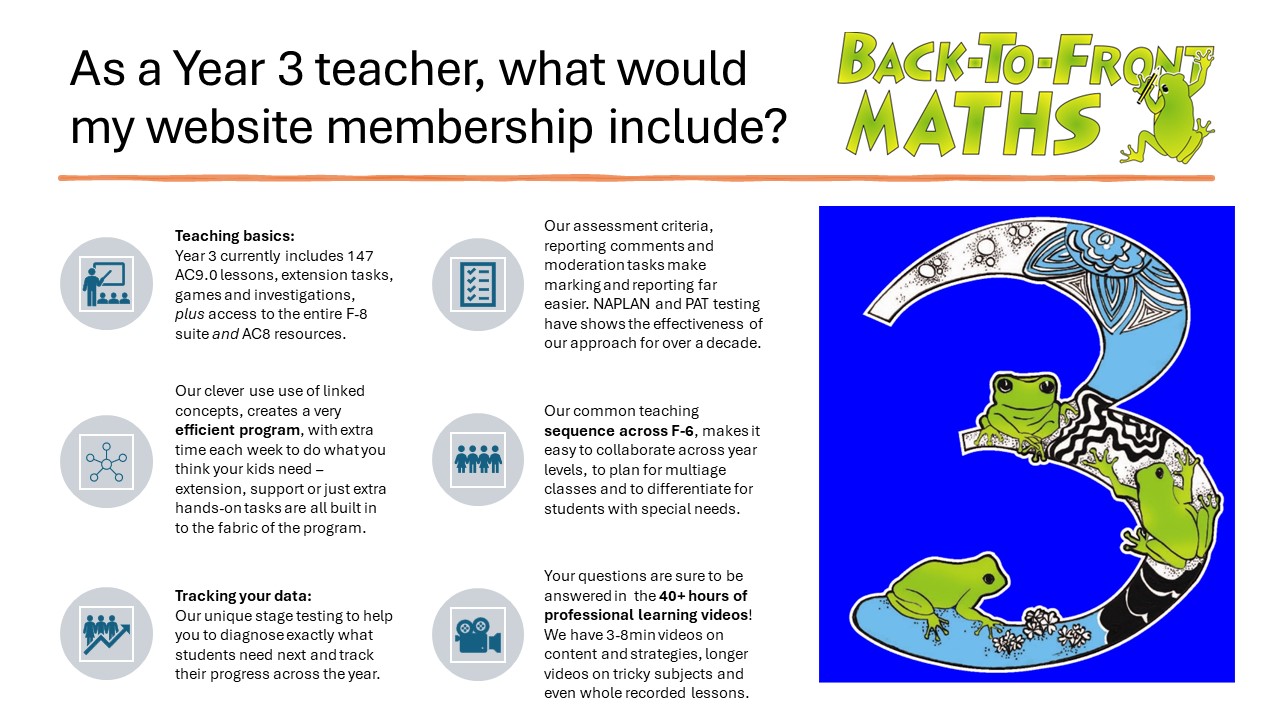
Here’s an example of what membership includes specifically for Year 3… plus all subscribers have access to EVERY SINGLE year level.
The goal of formative assessment should always be to find out what each student NEEDS next, rather than focusing
Recently I’ve been pondering findings from a major report into Australian schooling that kids who are struggling in maths by
This past year I made a deliberate decision to change how I worked. Instead of thinking in terms of the

Teachers often tell me how hard it is to get their students to understand subtraction. I’ve been reflecting on this
With the year just beginning, it’s worth investing a few minutes putting together these simple maths hacks to save you
These resources are for use with the Assessment course. Dowload student sample work for the experimental problem. Download student sample