Back to Front Maths for F-6 now meets the requirements for AC9.0. The program is live. Lessons will also be progressively rewritten over the coming 2 years to be simpler for teachers to implement.
Note: remember to check out the strategies videos in the content-shorts section of the Professional Learning Videos.
Concepts in the Term 1 program relate to developing the rational number line through the concepts of Quantity, Partitioning and Relative Size. Non-number concepts that are related to number lines are also taught in this term to develop strong, connected understanding.
We begin by establishing and/or revising understanding of each Quantity. This means understanding the concept of “how many for each quantity?” and also “what changes the quantity?”. In older year levels, this generally means revising Place Value from the previous year level, ensuring that students have a solid understanding before we introduce more complex amounts. We carefully establish the order and sequence of quantities along the rational number line.
As part of developing our understanding of Number, we also focus on Partitioning each quantity (breaking it into parts and combining parts to make a whole). This includes adding and subtracting, understanding of regrouping, and introducing integers. When subtracting, we focus on the ideas of “separating” and “difference” rather than “taking away”, making use of students’ intuitive ideas along with modelling using physical materials and number lines, to ensure that integers make more sense in later years. When recording our thinking, we introduce and establish horizontal algorithms as a priority, as these algorithms continue to be used in higher year levels (such as with algebra, fractions and formulas).
In middle and upper primary, we also seek to establish the concept of Relative Size using the number line. This involves an estimation of “about how big” numbers are in relation to each other. 100 is a very large quantity when compared to 1, but a very small quantity when compared to 1000. Relative Size helps us to estimate and to round. Relative Size is also an essential building block for understanding fractions and decimals.
In this term we also use the concept of a number line to develop measurement concepts related to a number line. This includes understanding of length, capacity (e.g., filling up a jug one cup at a time and marking the water level on the outside to develop a scale), mass, temperature, time and angles.
Length
In junior primary, we use a “go between” such as receipt roll to indirectly-compare the lengths of objects. Next, we measure the same lengths using non-standard units such as hand prints, and begin constructing our own “rulers” using the receipt roll and our hand prints. This leads into the development of a one-metre measuring tape in middle-primary using the same receipt roll (including centimetres, millimetres and decimal representations as appropriate). Note the metre-long number line to 1000 means that each number is 1mm. The placement of a 100block on the line will come to 100mm. This is important for the next section. The number line is also bent around shapes to measure perimeter, then combined with previous learning on addition to establish the rule for perimeter.
Capacity
In junior primary we directly compare the capacities of different vessels by pouring from one to the other. Next, we use non-standard units such as a cup to compare the capacities of different vessels, creating a scale on the side of a clear vessel by drawing a line to mark the water level after adding each cup. This leads to the development of measurements in millilitres and litres. Note: the metre-long number line to 1000 can be used to represent 1000mL in 1L. MAB blocks take up 1cm3. This is the same amount of space as 1mL. So a 100block, when placed on the metre-long line will come to the 100mL position.
Mass
In junior primary we begin by directly comparing the mass of objects. Hefting and using a balance beam/scales are both good models to introduce, but please emphasise the balance beam/scales. Next, we use a balance beam or balance scale to balance/measure a mass using non-standard units. This leads on to using standard units of grams. Note: 1mL of water at sea level weighs 1g. The wooden MAB are designed to this scale as well, so the 1block from MAB will also weigh 1g. This means that we can use the metre-long number line to 1000 to also represent grams per kilogram.
Unit conversion
In older year levels we convert between units of length, capacity and mass using our knowledge of number lines and also using a place value chart.
Time
In upper primary, a number line is also used to make a clock. We consider units of time and duration (including adding and subtracting time using horizontal formats, converting to 24 hour time and using units).
E.g., It is Monday at 6:35pm. What time will it be in 2 days, 5 hours and 40 minutes?
Monday 6:35pm = 1d 18h 35m.
1d 18h 35m + 2d 5h 40m
= 3d + 23h + 75m
= 3d + 24h + 15m
= 4d + 15m, or Thursday at 12:15am.
Mapping and Grids
We also recognise that longitude and the time zones are related, linking time, distance and degrees. In Years 3-6 this includes using more formal maps and plans with standard units and grid references (alpha-numeric in 3-4 and numeric in 5-6). More time is spent developing grid references in multiple quadrants in term 4.
Concepts in the Term 2 program relate to structuring and grouping quantities into multiples to develop mental objects and multiplicative thinking. Array and area models are used to develop understanding of number properties, area, volume (3D cubes stacked in an array), and fractions. Grids are used to develop understanding of maps and plans. Skip counting is used to help students count minutes on a clock face.
We begin by thinking in Arrays for numbers up to 10 and onto 20 (such as using a tens frame). Next, the array is developed to represent simple multiplication and division situations, including skip counting (e.g., sharing 20 counters into 4 rows to represent dividing a class of 20 students into 4 teams; making pairs and skip-counting in 2s; skip-counting larger amounts in 5s and 10s as a precursor for place value of larger amounts).
Due to their visual nature, arrays enable stronger understanding of the commutative property of multiplication (2×4=4×2). They also enable students to explore odd and even numbers and understand why adding two odd numbers together makes an even number. Arrays are also developed to represent prime, composite and square numbers.
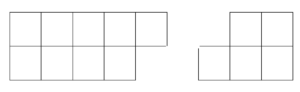
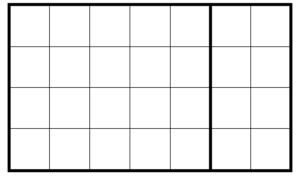
The array is developed into the more-structured Area model using square materials such as tiles. Students learn to draw a rectangle and cut it into parts, to develop a stronger concept of division and link to fractions from year 2/3. The area model is combined with partitioning to visually introduce the distributive property of multiplication, making it easier to work out multiplication facts that students find difficult to recall.
4 x 7 = 4 x (5+2) = 4×5 + 4×2
The area model is used to model division situations with remainders from year 4, then to split these remainders into fractions and decimals from year 5. The area model and the number line are also used to revise previous learning on fractions.
Area from year 4-6
The area model for multiplication is used to introduce measuring areas in square units. The representation of multiplication as “base x height” allows easy introduction for a formula for area of a rectangle.
Angles and turns
In junior primary we develop an understanding of turn (including quarter and half turns). This leads to developing the concepts of angles and comparing them to quarter turns (right angles). It is also used to tell time to the quarter hour, and to lead into giving directions.
In middle primary we use a number line from 0-360, to bend around and make a protractor. We fold a circle into parts to make specific angles and link with fractions. We use our folded circle to measure angles of 3D solids and 2D shapes. In upper primary we may also use the protractor to consider fractions of circles and circle graphs. The extension tasks relate the idea of degrees in a circle to days in a year and discuss the development of a circular calendar in many cultures.
Time for junior primary
In junior primary we begin by considering the regular sequences in time (morning, lunch time, afternoon, evening, night; days of the week; months of the year; events each year). We begin developing reference points for time (e.g., what do we do in the mornings?), and start to build an understanding of comparing and measuring duration (e.g., how many jumps I can do in a minute, “5 minutes until we pack up”). Next, we look at the hours on a clock and how the hour-hand moves between then. This allows us to tell the time of day with reasonable accuracy without needing the minute-hand. It is often useful to use a number line from 0-12 and bend it around to make a clock face.
The skip-counting established in the first few weeks enables students to skip-count the minutes in an hour to read the time shown by the minute-hand. Once students are confident with both hours and skip counting, we introduce the minute-hand and examine how it moves over the course of an hour (students need to be familiar with a number line to 60 for this to work).
Shapes and Solids for upper primary
We compare and shapes (2D) and solids (3D) to find similar properties (e.g., number of sides in shapes, flat or curved solids). We begin developing a classification system using properties (e.g., rectangles and squares are related because they both have four straight sides and four right angles). We use formal geometric terminology to describe shapes and solids (e.g., using “parallel” from year 2 onwards). These concepts are taught in more depth in term 4.
Directional language for junior primary
Students in junior primary spend a week developing vocabulary for talking about directions (e.g., left and right, above and below, towards the door) and revising distance (e.g., two steps) while students in 4-6 revise fractions. The grid-like structure used for arrays/area model is now overlaid to create maps and plans, with each square representing a unit of distance. In F-2, this can include making a 3D representation of a city or our classroom using boxes, with a grid drawn beneath. Students can give directions for “driving” a toy car around the city (e.g., turn left at the intersection and drive past two buildings).
In term 2, we use the multiplicative thinking from Term 2 to develop an understanding of Place Value for large numbers and decimal numbers. We also use our area and number line models to develop an understanding of Proportional Reasoning and represent fractions, decimals and percentages. We link ordinal numbers with fractions. We conduct chance experiments and link both fractions and a number line from 0-1 to develop an understanding of chance (Probability). We also use multiplicative thinking to develop our understanding of collecting and collating data, and link this with a number line to graph and analyse results (Statistics).
Term 3 begins with long block of time for introducing larger whole numbers (F-3). Students work on number lines, both with reference points and without (e.g., a number line from 0-1000 with markings at each 100, or without any markings). Students use hundreds charts to structure numbers using place value, and place-value charts to regroup larger numbers. A smaller amount of time is used to develop a simple understanding of fractions and link fraction words with ordinal numbers.
Students in 4-6 use the same period to explore place value of decimal numbers and link fractions, decimals and percentages together. They apply what they know about operations with whole numbers to fractions, using the area model to add, subtract and multiply fractions as appropriate.
Chance or probability
All students explore chance experiments and gathering data. They collect data using tables, lists and charts (e.g., tally marks, or tossing 10 coins and using a picture of each coin to show the result). They discuss and compare the frequency of the distribution of results (e.g., “I threw 6 heads and 4 tails, but my friend threw 3 heads and 7 tails”). This leads to concepts such as the importance of sample size and repetition (“the more times we toss a coin the more likely we are to approach a 50:50 distribution of heads:tails), and the independence of each result (“the coin doesn’t remember that it landed on heads last time, so this time it is equally likely to land on either heads or tails”). Chance is formally introduced in year 3, including classifying events using terminology (e.g., likely, unlikely, equally likely, more likely, certain, impossible). We use software to run simulations of many events to see the patterns in outcomes. In years 4 and 5, we use fractions to represent the frequency distribution of our results (e.g., 6/10 of my throws landed on tails). In year 6 we introduce formal probability (e.g., as there are only two options, the chance of landing on a tail is ½ or 50%).
Data or statistics
Students plan statistical investigations and gather data. They classify non-numerical data into categories, and group discrete numerical data. They compare and contrast data and use reasoning to describe their findings. They display data, including making use of number lines for scales. In year 5, we include continuous data and line graphs. Statistics is a big part of AC 9.0.
In term 4, students build on their knowledge of all four operations to explore patterns, algebra and computational thinking. JP students use money, then apply money to practise their operations. UP students use money as a context for algebraic operations, linear graphing, budgeting and percentage discounts. Extra time is provided for meeting Place Value requirements beyond the achievement standard; and all students also have time for additional geometry, including 2D shapes, 3D solids, transformations (translate or slide, reflect or flip, and turn), tessellations and four-quadrant graphing.
All four operations are combined to explore patterns and functions. Students consider “what happened” to consistently turn one number into a related number using models such as a function machine. For example, the function might “double” the input number.
Money is introduced, with JP students asked to make amounts using different combinations of notes and coins and compare the value of different items (e.g., making a pretend shop for Foundation students where all prices are in whole dollars).
UP students are introduced to more formal methods for writing equations, including using a consistent order of operations, based on the “power” or “dimension” of each operation. Brackets or parentheses always come first, then operations follow based on their dimensions.
This means that addition is not done before subtraction – they are on an equal tier so are just done left to right.
UP students combine their knowledge of operations and functions to explore budgeting and percentage. They use budgeting/money as a context to introduce linear equations and functions, including integers and graphing across all four quadrants (e.g., paying off a loan each week).
Geometry
Students explore and classify 3D solids and 2D shapes by properties. This includes using some analytical geometry for 2D shapes in UP (e.g., angles on a line sum to 180o). They explore patterns formed by transforming shapes (flip/slide/turn) and determine which shapes will always tessellate. UP students transform shapes by translating them on the cartesian plane (e.g., adding 5 to all x coordinates for the points on a triangle will shift it 5 places to the right).
The proficiency strands are not an added-extra to the curriculum – they describe the “real maths” (Kim Beswick, AAMT), or “the verbs” of the curriculum (Prof. Peter Sullivan, principal author of the Framing Paper and curriculum).
They also form the basis for assessment, which is set out clearly in the Framing Paper. For those of you using Back to Front Maths, make sure to check out the Assessment Bank which has criteria sheets, information on when and how to assess and even moderation tasks to ensure consistency across your school.
Here’s a quote from ACARA to help explain the focus on proficiency strands in the Australian Curriculum:
“The curriculum focuses on developing increasingly sophisticated and refined mathematical understanding, fluency, logical reasoning, analytical thought and problem-solving skills. These capabilities enable students to respond to familiar and unfamiliar situations by employing mathematical strategies to make informed decisions and solve problems efficiently.
The curriculum anticipates that schools will ensure all students benefit from access to the power of mathematical reasoning and learn to apply their mathematical understanding creatively and efficiently. The mathematics curriculum provides students with carefully paced, in-depth study of critical skills and concepts. It encourages teachers to help students become self-motivated, confident learners through inquiry and active participation in challenging and engaging experiences.”
http://www.australiancurriculum.edu.au/Mathematics/Curriculum/F-10